Top 3 Reporting Automation Tools
After hands-on testing in multiple data-driven organizations (mainly in enterprise and consulting sectors), we evaluated four popular BI tools: Tableau, Power BI, Qlik, Domo
![]()
Top 1
![]()
Best for hybrid-cloud companies
Best for teams' adoption
Top Pick: Tableau
![]()
Best Overall Reporting Automation Tool in 2025
If you're looking for a powerful yet user-friendly solution that your team can deploy immediately, Tableau is our #1 recommendation. It offers deep data insights, enhances decision-making, and improves how business results are communicated.
📌 Best for: Companies with varying levels of data maturity
📌 Pricing: $42/user/month (Tableau Explorer plan)
📌 Free version: Yes, plus a 14-day free trial
Why Tableau?
Tableau stands out among reporting automation software for its strong UX, flexible analytics capabilities, and intuitive interface. Here's why we recommend it:
🔹 Ease of use – connects to a wide range of data sources with an intuitive drag-and-drop UI and built-in collaboration features
🔹 Security – strong enterprise-grade data protection
🔹 User customization – adaptable to user roles and company branding
🔹 Deployment flexibility – available across IaaS, SaaS, PaaS, and on-premise environments (though OS support could improve)
🔹 Report publishing – allows seamless sharing of dashboards and public reports.
Download report here.
Power BI – best for hybrid cloud
![]()
Download report here.
Looking for an Instant Reporting Automation Solution That Works Across Multi-Cloud Environments? Power BI is second-highest recommended tool for reporting automation, offering deep data analysis, streamlined decision-making, and more engaging communication with stakeholders. If your goal is full control over your data and how it’s used, Power BI should be your first choice.
📌 Best for: companies operating in multi-cloud environments
📌 Price: $20/user/month (Power BI Premium Per User)
📌 Free version: Yes. Power BI Pro offers a 60-day free trial
Why Choose Power BI?
Power BI is a robust reporting automation software known for its advanced data modeling and smooth navigation.
✅ Advanced data modeling – enables flexible data transformation and analysis without relying on external tools.
✅ Power Query – built-in data prep features eliminate the need for extra software (a key advantage over Tableau and Qlik).
✅ User-friendly navigation – smooth transitions between report pages make dashboards more intuitive.
✅ Flexible deployment – available via Per User licensing or organization-wide with Power BI Premium Per Capacity.
✅ Widespread adoption – Power BI holds approximately 14% of the BI tools market share.
Power BI drawbacks
⚠ No native MacOS desktop version – Mac users may face limitations using the local version.
⚠ Data loading issues in the free version – initial data imports may require manual configuration.
⚠ No public reports by default – requires adjustments in privacy settings to enable public sharing.
Despite these limitations, Power BI stands out as one of the top reporting automation tools - offering intuitive design, smooth report navigation, and strong market presence.
DOMO

Cannot be shared.
DOMO is a powerful reporting automation software that stands out for its strong collaboration features, making it especially appealing to teams. With tools like unlimited card sharing, built-in chat, and task/project management, DOMO fosters team-based decision-making. Its intuitive data visualization tools allow for quick onboarding, helping teams start leveraging valuable insights almost immediately.
📌 Best for: companies prioritizing team collaboration
📌 Pricing: not publicly disclosed
📌 Free trial: 30-day trial available
DOMO Pros
DOMO brings a wide range of features to the table, though like any reporting automation tool, it has both strengths and limitations.
✅ User-friendly visualizations – easily build clear, visually appealing reports without advanced training.
✅ Robust analytics – includes real-time reporting, custom views, interactive dashboards, and advanced data blending options.
✅ Team collaboration – built-in features for communication, task management, and cross-team reporting make it ideal for group workflows.
Cons DOMO
⚠ No free tier – unlike Power BI and Tableau, DOMO doesn’t offer a free version, which may be a barrier for startups and smaller businesses.
⚠ No desktop version – users who prefer offline work may face limitations.
⚠ Steep learning curve – the UI can be complex, especially for new users unfamiliar with BI tools.
⚠ CSV formatting issues – problems with number formatting when using commas as thousand separators.
⚠ Non-intuitive data transformation – DOMO uses a proprietary pseudo-SQL syntax, offering limited guidance for users unfamiliar with coding.
Another downside is the lack of publicly available pricing, which can make budget planning difficult. Despite its feature-rich platform, DOMO holds about 1% of the BI reporting software market, making it a niche but capable player in the 2025 reporting automation landscape.
QLIK
![]()
Download report here.
QLIK is a strong reporting automation alternative for companies that need deep data analysis, precise decision-making, and dynamic customer communication—all in a web and cloud-based environment.
📌 Best for: Companies operating in browser-based and cloud-first ecosystems
📌 Pricing: $825/month for 20 users
📌 Free trial: 30-day trial available
QLIK: Pros
✅ Advanced analytics capabilities – a great fit for users needing in-depth data exploration and complex metrics.
✅ Data privacy features – columns can be tagged as Personal or Sensitive, adding an extra layer of data protection.
✅ Security and compliance – built-in tools help organizations manage sensitive information responsibly.
QLIK: cons
⚠ High learning curve – working with complex measures and formulas often requires additional training.
⚠ No free version – only a 30-day trial; unlike Power BI and Tableau, QLIK doesn’t offer a permanent free tier.
⚠ Measure editing issues – renaming a measure breaks dependent calculations, which must be fixed manually.
⚠ Non-intuitive developer interface – editing options vary by mode, which can lead to confusion.
⚠ Navigation limitations – no easy way to build drill-through paths or page-to-page transitions.
While QLIK offers powerful analytical capabilities, its reporting software interface and formula handling could be more user-friendly. Still, for data-driven organizations prioritizing depth and control, QLIK is a serious contender—currently holding around 5% market share in the BI and reporting automation space.
What Criteria Should You Consider When Choosing Reporting Automation Software?
Selecting the right reporting automation tool requires evaluating key factors that impact your organization’s ability to analyze data efficiently. Below are the most important considerations:
✅ User Experience (UX) – intuitive interface, ease of navigation, and time needed for team onboarding
✅ Customization – ability to personalize dashboards, reports, and data visualizations
✅ Data Connectivity – integration with databases, ERP, CRM, and cloud platforms
✅ Collaboration Features – sharing reports, team collaboration, and in-tool communication
✅ Cost – per-user or team licensing, availability of free versions or trials
✅ Real-Time Reporting – access to live data and automatic refresh capabilities
✅ Support & Training – availability of documentation, courses, and technical support
✅ AI Features – use of artificial intelligence for data analysis and insight generation
✅ Deployment Models – compatibility with IaaS, SaaS, PaaS, and On-Premise environments
✅ OS Compatibility – support for Windows, MacOS, and Linux
✅ Security – access control, data encryption, and compliance with data protection regulations
✅ Analyst Ratings – Gartner and Forrester recommendations as proof of market leadership
In our tests, we assumed that creating a standard report should take no longer than 2 hours—using default templates and without complex calculations. The test reports included one page transition and three visualizations on a single dashboard.
Choosing the right reporting software depends on your organization’s structure, available resources, and strategic priorities:
- Power BI: Ideal for businesses already embedded in the Microsoft ecosystem - - - Tableau: Best for teams needing advanced data visualizations
- Domo: Great fit for collaboration-focused environments
- Qlik: Recommended for users needing detailed, exploratory data analysis
With the right tool, reporting automation can dramatically boost decision-making speed, team productivity, and overall business intelligence maturity.
Comparison of BI Reporting Automation Tools – Tableau vs. Power BI vs. DOMO vs. QLIK
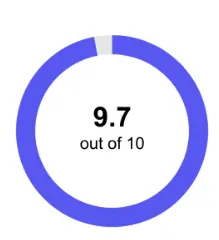
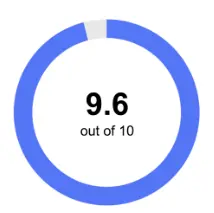
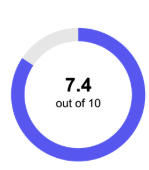
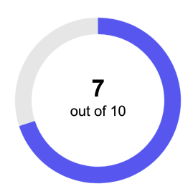
In this comparative analysis of four popular reporting automation and data visualization tools—Tableau, Power BI, DOMO, and QLIK—each platform was evaluated based on key features and performance indicators. Tableau came out on top with a score of 9.7, followed closely by Power BI at 9.6. DOMO and QLIK scored lower, with 7.4 and 7.0 respectively, showing room for improvement in certain areas.
Category | Key Features | Power BI | Tableau | QLIK | DOMO |
End-User Features | • Interactive visualizations | ✅ | ✅ | ✅ | ✅ |
Customization | • Visualization personalization | ✅ | ✅ | ✅ | ✅ |
Data Connectivity | • 100+ data source integrations | ✅ | ✅ | ✅ | ✅ |
Collaboration | • Report sharing | ✅ | ✅ | ✅ | ✅ |
Real-Time Reporting | • Data refresh frequency | ✅ | ✅ | ✅ | ✅ |
Management & Admin | • Data security | ✅ | ✅ | ✅ | ✅ |
Data Interaction | • Working with dashboards | ✅ | ✅ | ✅ | ✅ |
✅ End-user functionality – All four reporting software platforms—Tableau, Power BI, QLIK, and DOMO—offer core features like interactive visualizations, custom views, and trend forecasting.
✅ Customization – when it comes to personalizing dashboards, modeling data, and embedding via APIs, Power BI, Tableau, and DOMO performed strongly. QLIK, however, showed some limitations in flexibility.
✅ Data connectivity – all tools support integration with 100+ data sources, direct querying, and building data pipelines—making them suitable for complex data environments
✅ Collaboration tools – each platform includes features for report sharing, dashboard commenting, and report subscriptions, supporting team communication and knowledge sharing.
✅ Data management and administration – all four reporting automation solutions provide advanced security features, user access control, and application lifecycle management.
✅ User experience – Tableau and Power BI clearly outperformed QLIK and DOMO in terms of interface intuitiveness and smooth user interaction.
Summary: Which Reporting Software Is Right for You?
🔹 Tableau – while it comes at a higher price, it offers the broadest feature set, best usability, and strongest industry reputation, making it ideal for mature data teams.
🔹 Power BI – delivers nearly the same capabilities as Tableau at a much lower cost, making it a highly cost-effective reporting automation tool.
🔹 QLIK – excels in advanced analytics, but is less user-friendly and comes at a higher price point, which could be a barrier for some organizations.
🔹 DOMO – known for its team collaboration features, but its lack of pricing transparency and steeper learning curve may deter businesses looking for a simpler, quicker-to-implement solution.
If ease of use and ROI are your priorities, Power BI is the strongest value. If advanced visuals and polish matter most, Tableau is the top performer in the 2025 reporting automation software landscape.
Are you looking for reporting automation software?
Contact us, we will reply in 24 hours